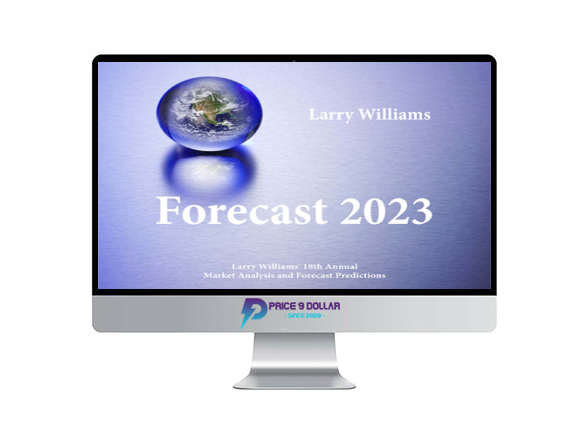
[Special Offer] Larry Williams – Annual Forecast Report 2023
$199.00 $59.00
Sale page: https://www.ireallytrade.com/forecasts/
Larry Williams – Annual Forecast Report 2023
Description
Larry Williams – Annual Forecast Report 2023
Description of Annual Forecast Report 2023
- My futures market analysis and predictions for the upcoming year in a single PDF report
- Individual forecasts for the major indexes in Australia, Japan, China, Germany, Russia, Canada, Brazil, Korea, Great Britain, India, Hong Kong, and Italy
- My personal view of where US Stocks, Bonds, Metals, Currencies, Grains, Softs – all the major futures markets – are headed in 2023
- Use my Cycle Forecast Charts as individual roadmaps for each market
- Our 26th Forecast Report-18th Annual Edition
- Trusted By Traders and Investors in 67 Countries
Now you can know A year in advance
When the most significant moves should take place
In all major stock indexes and commodities
What You’ll Learn In Annual Forecast Report 2023
In this year’s forecast you will be given my personally created roadmaps for virtually all major stock market indexes, futures and stocks throughout the world.
This year’s report is over 100 pages long. It is a complete report. Concise, yes, covering the S&P E-minis, Dow, bonds, precious metals, the grains, softs, all the major currencies, energies, stock markets of the world, and select individual stocks.
Simply put, there is nothing else quite like this because my report covers the majority of the futures markets. I also make projections for major stocks – 30 of them this year – including Warren Buffets favorite 5!
Here are the stocks in this report:
Alphabet Inc. (GOOG), Amazon (AMZN), American Express (AXP), Annaly Cap Management (NLY), Apple (AAPL), Bank of America (BAC), Berkshire Hathaway (BRK-B), Chevron (CVX), Coca-Cola (KO), Costco (COST), Disney (DIS), Exxon (XOM), Fastenal Company (FAST), Ford (F), Home Depot (HD), International Business Machines (IBM), Jack Henry & Associates (JKHY), Kraft Heinz Company (KHC), Merck & Co. (MRK), Meta Platforms (META), Microsoft (MSFT), NVIDIA Corporation (NVDA),Pfizer Inc. (PFE), Procter & Gamble Company (PG), ProShares Inflation Expectations ETF (RINF), Target Corporation (TGT),Tesla Inc. (TSLA), Verizon Communications Inc (VZ), Visa Inc. (V), Walmart Inc. (WMT)
In Addition To My Roadmaps, You Will Learn All This
The Best Trades of the Year
- I will be showing you the very best times of the year in 2023 to buy S&P 500 E-minis, Crude Oil, Gold, Bonds and as a special surprise market with 94% accuracy for these trades in the last 54 years with an average profit per trade over $4,000. This one little trade alone is worth the cost of the entire report.
- There are two S&P 500 E-minis trades that have been over 90% accurate, netting almost $60,000 in profits total for the last X years (avg profit per trade of ).
- Gold bugs will see the best times of the year in their market; the top three trades show over 80% winners, racking up almost $80,000 in total winnings.
- Nothing hedged here. You will know the exact trading day to buy.
How to Really Use Cycles
- I will teach you the best way to use cycles; they can be tricky and, in many cases, you will know the % accuracy of the projected moves!
The Yield Curve Straightened Out
- This year I’m taking a deep dive into the Yield Curve. You will see its history vs stock prices which is not at all what the talking heads claim. You will know the facts and also how I project out into the future what it will be doing!
GDP Forecast
- My GDP model, which I reveal in full, suggests we are going to see an uptick in GDP growth. That’s bullish for stocks and will catch the Street by surprise, as most are projecting a spiral down in GDP.
The Best Stock Market Sell Signals Come from This Indicator
- We will look at this indicator all the way back to 1948. Then I will show you a simple way to use this tool to call major market tops.
- Currently the model is bullish. So we must be on guard for a sell signal.
Predict Unemployment!
- Yes, this year’s report shows an elegant model that has done an excellent job of telling us when the all-important FED Unemployment numbers will trend up or down. This is a must study to read.
Know When the Recession Begins
There is an ocean full of indicators to help us spot the start of recessions. The best I have found are based on the following:
- Industrial Production (one-year percentage change)
- Non-farm Payrolls (one-year percentage change)
- Return of the Stock Market (one-year return)
- Slope of the Yield Curve
But, there is one – and only one – indicator that is better than all of these. I will explain it to you and give you the URL so you can follow it through the year.
Salepage: Larry Williams – Annual Forecast Report 2023
Delivery Policy
When will I receive my course?
You will receive a link to download your course immediately or within 1 to 21 days. It depends on the product you buy, so please read the short description of the product carefully before making a purchase.
How is my course delivered?
We share courses through Google Drive, so once your order is complete, you'll receive an invitation to view the course in your email.
To avoid any delay in delivery, please provide a Google mail and enter your email address correctly in the Checkout Page.
In case you submit a wrong email address, please contact us to resend the course to the correct email.
How do I check status of my order?
Please log in to Price9Dollar account then go to Order Page. You will find all your orders includes number, date, status and total price.
If the status is Processing: Your course is being uploaded. Please be patient and wait for us to complete your order. If your order has multiple courses and one of them has not been updated with the download link, the status of the order is also Processing.
If the status is Completed: Your course is ready for immediate download. Click "VIEW" to view details and download the course.
Where can I find my course?
Once your order is complete, a link to download the course will automatically be sent to your email.
You can also get the download link by logging into your Price9Dollar account then going to Downloads Page.
![[Special Offer] Top Trade Tools – Swing Trader Pro 1 Top Trade Tools – Swing Trader Pro](https://price9dollar.net/wp-content/uploads/2023/02/Top-Trade-Tools-100x100.png)
![[Special Offer] Larry Williams – Annual Forecast Report 2023 3](https://i.imgur.com/xMlTEu6.gif)


